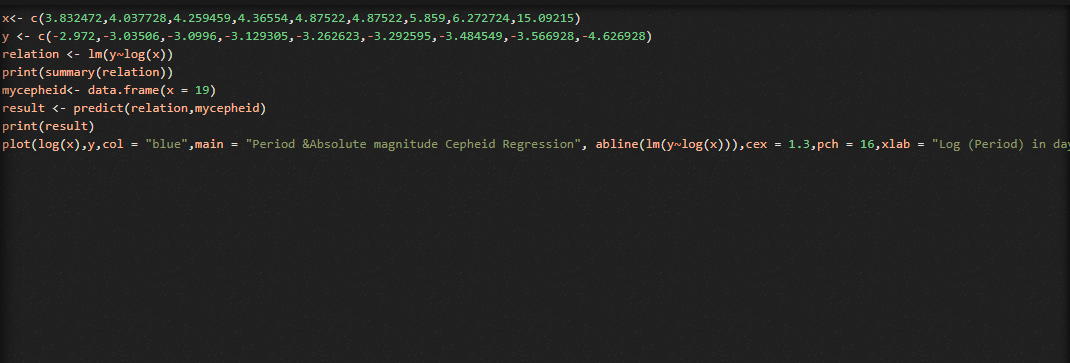
GRAPHIC
This graphic shows the relation of the Magnitude and the period days of 509 cepheids.
In this article written by Daniel J. Majaess from Saint Mary’s University and The Abbey Ridge Observatory in Canada observed that in Centaurus there are 5 different type 2 cepheids.
As it is referenced in Wikipedia, these cepheids have a period comprehended between 1 and 50 days and so I will calculate the absolute magnitude (M) in these range. I've used the formula from the ESA/ESO astronomy book and the resulting formula of the graphic.
ESA/ESO BOOK FORMULA
1- PERIOD : 1
Mmin= -2,78 log(P) - 1,35
Mmin= -2,78 log(1) - 1,35
Mmin= -1,35
2- PERIOD : 50
Mmax= -2,78 log(P) - 1,35
Mmax= -2,78 log(50) - 1,35
Mmax= -6,07
The magnitud from cepheids it is ranged from (-1,35) to (-6,07)
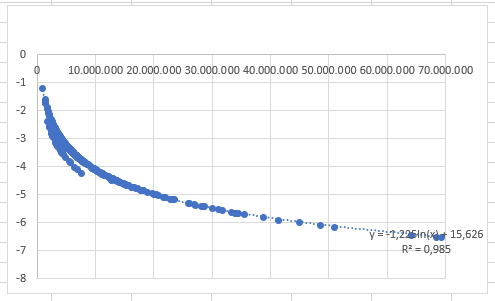
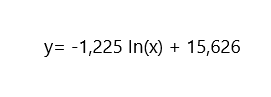
FORMULA OF THE GRAPHIC:
1- PERIOD : 1
Mmin= - 1,22In (P) + 15,626
Mmin= - 1,22In (1) - 1,35
Mmin= -1,35
2- PERIOD : 50
Mmax= - 1,22In (P) + 15,626
Mmax= - 1,22In (50) - 1,35
Mmax= -6,12
The magnitud from cepheids it is ranged from (-1,35) to (-6,12)
Then I have calculate the distance (D) with the formula of the ESA/ESO astronomy book.
Mmin= -1,35
m= 4,91
D= 10^(m-M+5)/5
D= 10^(4,91-(-1,35)+5)/5
D= 3,6394· 10^10pc
Mmax= -6,1
m= 4,91
D= 10^(m-M+5)/5
D= 10^(4,91-(-6,1)+5)/5
D= 2,046·10^15pc
I haven't found any table related to the magnitude-period of my constelation, I only found this article which have a table that indicates position and properties. For this reason I used cassiopea graphic.